
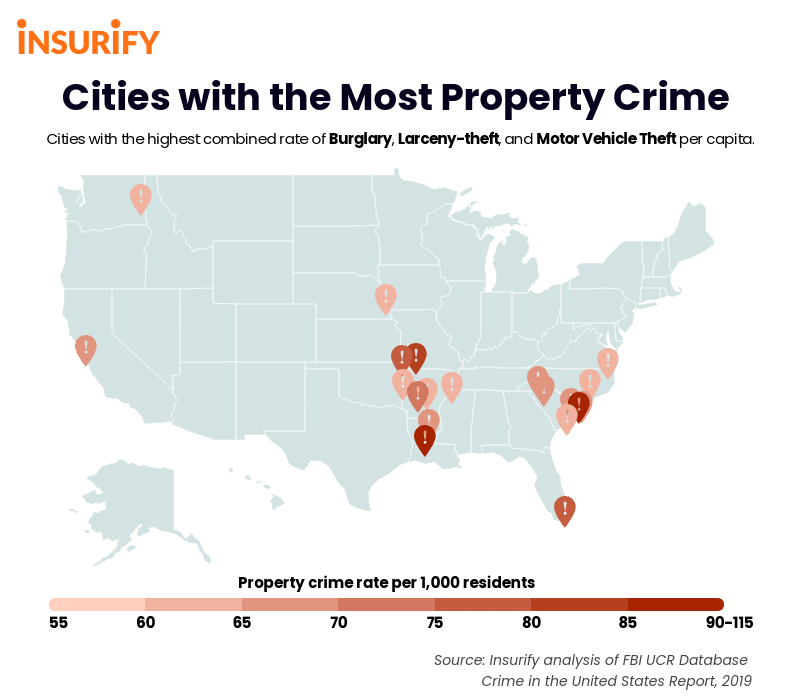
Crime Capitals: Cities with the Most Property Crime
Although property crime has decreased dramatically since 1990 nationwide, it still occurs at alarmingly high rates in many cities across the United States.
Over the last year in the United States, an average of almost 19 thousand property crime offenses occurred each day. In 2019, an estimated 6.93 million property crime offenses occurred in the United States, according to the FBI Uniform Crime Reporting database. 6.93 million offenses in the last year might seem astronomically high, but property crime in the United States has actually been on the decline. In fact, the property crime rate has decreased by 24 percent since 2010, and over 58 percent since 1990. Despite this overall decrease in property crime over the past few decades, property crime is still a pervasive problem that disproportionately affects some cities more than others.
Property crime is a broad term encompassing nonviolent crimes including arson, burglary, larceny-theft, and motor vehicle theft. Larceny-theft accounts for the majority of property crimes year over year. It’s the most common form of property crime, accounting for 73.4 percent of all property crime offenses in 2019. Burglary, the second-most common, accounts for 15.2 percent of all property crime offenses in 2019.
While no car owner or homeowner is impervious to being the unfortunate target of motor vehicle theft or burglary, some are more susceptible than others. The most commonly targeted cars are older models, as their anti-theft technology tends to be less advanced than that of newer cars. On the other hand, the most commonly targeted homes for burglary are those that look easy to break into: those located on the outskirts of neighborhoods, those with poor lighting at night, and those with convenient points of entry and places on the property to hide.
Certain cities also seem to attract more property crime. To identify the cities with the most property crime per capita, the data science team at Insurify referred to the FBI’s latest Crime in the United States report on property crime rates by metropolitan area.
Insights
- National averages. Across all cities, the average rate of property crime per 1,000 residents is 29.34. The average rates of burglary, larceny-theft, and motor vehicle theft are 4.79, 22.92, and 3.61 per 1,000 residents, respectively.
- Southern Cities. Southern cities have by far the highest representation among the cities with the highest rates of property crime, making up 15 of the top 20. Midwestern and Western cities claimed 3 and 2 of the top 20 spots, respectively, while no Northeastern state made the list.
- Property crime, violent crime, and poverty level. Insurify’s data science team conducted a correlation analysis to determine the relationship between property crime, violent crime, and poverty rate in cities across the United States. They found that rates of property crime and violent crime have a moderate positive correlation Pearson’s R = 0.62. Simply put, cities with a high rate of property crime are moderately likely to have high rates of violent crime. On the other hand, according to Insurify’s analysis, poverty rates are not correlated with property crime or violent crime, Pearson’s R = 0.13 and 0.12, respectively.
Methodology
To identify the cities with the highest share of property crime, Insurify’s data scientists referred to the latest Crime in the United States report on property crime rates, published by the Federal Bureau of Investigation (FBI). From this report, Insurify's data science team identified the cities with the highest incidence of property crime per 1,000 residents. They also calculated the national average of property crime per 1,000 residents. Data on burglary, larceny-theft, and motor vehicle theft, for each of the top 20 cities were also gathered from this report.
Insurify’s data scientists also calculated how much more frequently property crime occurs in the top 20 cities, compared to the national average.

U.S. Cities with the Highest Property Crime Rate
20. Fort Smith, Arkansas
- Property crime rate per 1,000 residents: 58.23 (1.99 times the national average)
- Larceny-theft rate per 1,000 residents: 44.63
- Burglary rate per 1,000 residents: 9.22
- Motor vehicle theft per 1,000 residents: 4.38
19. Goldsboro, North Carolina
- Property crime rate per 1,000 residents: 58.24 (1.99 times higher than the national average)
- Larceny-theft rate per 1,000 residents: 44.18
- Burglary rate per 1,000 residents: 11.15
- Motor vehicle theft per 1,000 residents: 2.90
18. Council Bluffs, Iowa
- Property crime rate per 1,000 residents: 58.45 (1.99 times higher than the national average)
- Larceny-theft rate per 1,000 residents: 42.11
- Burglary rate per 1,000 residents: 8.47
- Motor vehicle theft per 1,000 residents: 7.87
17. Portsmouth, Virginia
- Property crime rate per 1,000 residents: 58.61 (2.00 times higher than the national average)
- Larceny-theft rate per 1,000 residents: 44.57
- Burglary rate per 1,000 residents: 9.00
- Motor vehicle theft per 1,000 residents: 5.04
16. Spokane, Washington
- Property crime rate per 1,000 residents: 59.19 (2.02 times higher than the national average)
- Larceny-theft rate per 1,000 residents: 45.48
- Burglary rate per 1,000 residents: 7.91
- Motor vehicle theft per 1,000 residents: 5.80
15. North Charleston, South Carolina
- Property crime rate per 1,000 residents: 62.19 (2.05 times higher than the national average)
- Larceny-theft rate per 1,000 residents: 44.43
- Burglary rate per 1,000 residents: 7.40
- Motor vehicle theft per 1,000 residents: 8.37
14. Little Rock, Arkansas
- Property crime rate per 1,000 residents: 61.22 (2.09 times higher than the national average)
- Larceny-theft rate per 1,000 residents: 46.96
- Burglary rate per 1,000 residents: 8.89
- Motor vehicle theft per 1,000 residents: 5.39
13. Memphis, Tennessee
- Property crime rate per 1,000 residents: 61.28 (2.09 times higher than the national average)
- Larceny-theft rate per 1,000 residents: 43.02
- Burglary rate per 1,000 residents: 12.04
- Motor vehicle theft per 1,000 residents: 6.22
12. Asheville, North Carolina
- Property crime rate per 1,000 residents: 63.25 (2.16 times higher than the national average)
- Larceny-theft rate per 1,000 residents: 48.61
- Burglary rate per 1,000 residents: 8.90
- Motor vehicle theft per 1,000 residents: 5.75
11. Oakland, California
- Property crime rate per 1,000 residents: 64.21 (2.19 times higher than the national average)
- Larceny-theft rate per 1,000 residents: 46.60
- Burglary rate per 1,000 residents: 5.99
- Motor vehicle theft per 1,000 residents: 11.61
10. Spartanburg, South Carolina
- Property crime rate per 1,000 residents: 64.89 (2.21 times higher than the national average)
- Larceny-theft rate per 1,000 residents: 48.71
- Burglary rate per 1,000 residents: 11.65
- Motor vehicle theft per 1,000 residents: 4.53
9. Monroe, Louisiana
- Property crime rate per 1,000 residents: 65.79 (2.24 times higher than the national average)
- Larceny-theft rate per 1,000 residents: 48.99
- Burglary rate per 1,000 residents: 13.05
- Motor vehicle theft per 1,000 residents: 3.75
8. North Myrtle Beach, South Carolina
- Property crime rate per 1,000 residents: 65.81 (2.24 times higher than the national average)
- Larceny-theft rate per 1,000 residents: 53.71
- Burglary rate per 1,000 residents: 6.37
- Motor vehicle theft per 1,000 residents: 5.73
7. Florence, South Carolina
- Property crime rate per 1,000 residents: 66.31 (2.26 times higher than the national average)
- Larceny-theft rate per 1,000 residents: 50.72
- Burglary rate per 1,000 residents: 10.31
- Motor vehicle theft per 1,000 residents: 5.29
6. Hot Springs, Arkansas
- Property crime rate per 1,000 residents: 71.76 (2.45 times higher than the national average)
- Larceny-theft rate per 1,000 residents: 45.89
- Burglary rate per 1,000 residents: 20.16
- Motor vehicle theft per 1,000 residents: 5.61
5. Joplin, Missouri
- Property crime rate per 1,000 residents: 72.62 (2.48 times higher than the national average)
- Larceny-theft rate per 1,000 residents: 55.59
- Burglary rate per 1,000 residents: 10.29
- Motor vehicle theft per 1,000 residents: 6.73
4. Miami Beach, Florida
- Property crime rate per 1,000 residents: 75.68 (2.58 times higher than the national average)
- Larceny-theft rate per 1,000 residents: 63.94
- Burglary rate per 1,000 residents: 7.78
- Motor vehicle theft per 1,000 residents: 3.97
3. Springfield, Missouri
- Property crime rate per 1,000 residents: 77.93 (2.66 times higher than the national average)
- Larceny-theft rate per 1,000 residents: 55.76
- Burglary rate per 1,000 residents: 12.22
- Motor vehicle theft per 1,000 residents: 9.95
2. Alexandria, Louisiana
- Property crime rate per 1,000 residents: 89.64 (3.06 times higher than the national average)
- Larceny-theft rate per 1,000 residents: 65.54
- Burglary rate per 1,000 residents: 19.13
- Motor vehicle theft per 1,000 residents: 4.98
Myrtle Beach, South Carolina
- Property crime rate per 1,000 residents: 112.34 (3.83 times higher than the national average)
- Larceny-theft rate per 1,000 residents: 97.07
- Burglary rate per 1,000 residents: 8.72
- Motor vehicle theft per 1,000 residents: 6.54
If you have questions or comments about this article, please contact insights@insurify.com.
More From 98.3 The Snake


